Jacob Ward Portfolio

Overview
This project evaluates the performance of the LD19 LiDAR sensor when detecting surfaces with different reflective properties, textures, and geometries. 2D point clouds were analyzed to determine how factors such as surface roughness, material reflectivity, and object curvature affect measurement accuracy. See the final report and presentation for more detailed information about the project.
Methodology
The LD19 LiDAR sensor was connected to a computer using a CP2102 USB-to-UART bridge and operated through the LD19 desktop software. The software displayed real-time 2D point cloud data and allowed for manual data collection during testing. By clicking on a point in the 2D point cloud, three key pieces of data were extracted: the angle of detection (in degrees), the measured distance to the object (in millimeters), and the reflected signal intensity. These values were used to analyze how different surface features impacted the LiDAR’s mapping accuracy.

Capstone Room Mapping
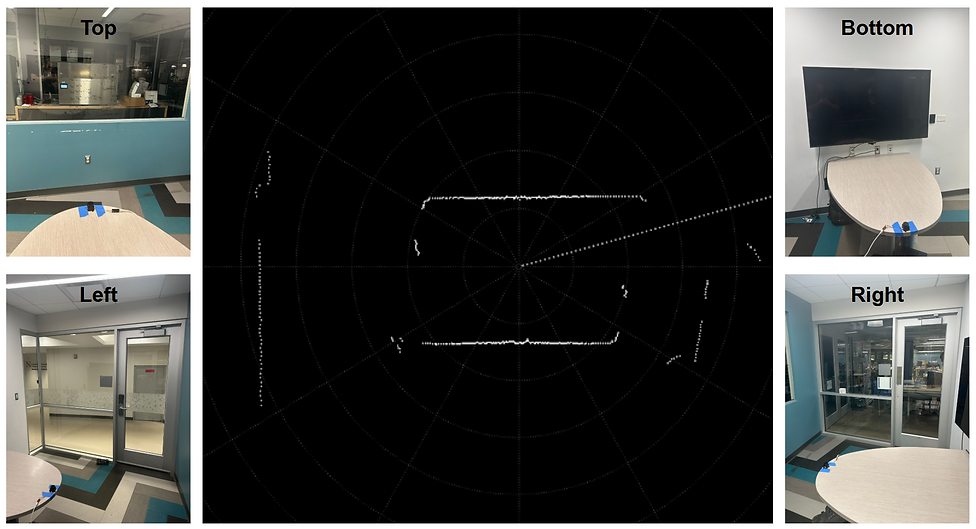
Before investigating the effects of various surface properties, the LD19 LiDAR was placed in the center of a Capstone study room to evaluate its ability to map a real-world environment. The figure below shows the resulting 2D point cloud, surrounded by images that showcase the walls of the room and the configuration of the LiDAR in the center. The resulting 2D point cloud successfully captured the positions of the solid walls on the top and bottom. It also captured the slight flaring and discontinuities in the left and right walls due to the metallic support beams and door. However, the LiDAR was unable to detect the glass windows, instead mapping objects located behind the glass.
Testing Results
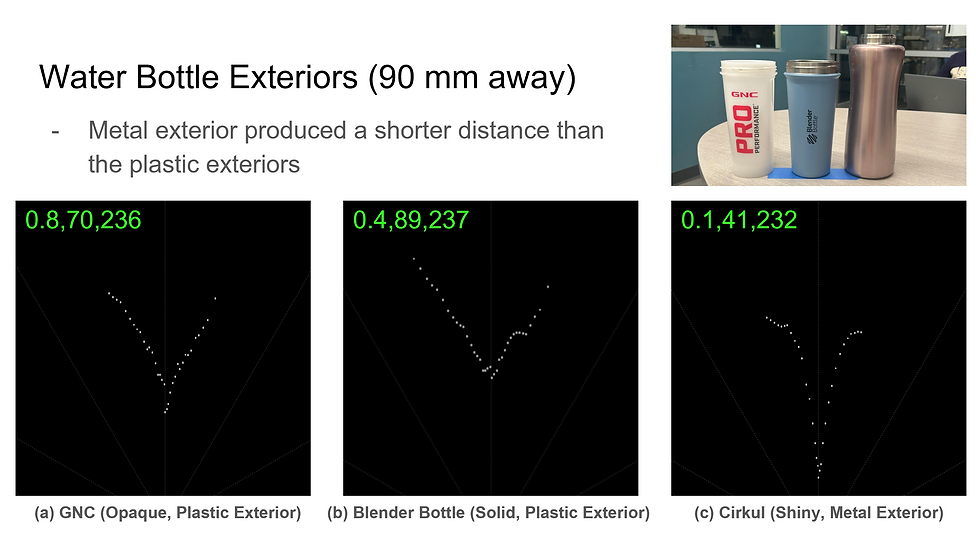
Reflective surfaces, such as smooth and rough aluminum foil, were used to observe how surface finish impacts distance accuracy. The interior and exterior of various water bottles (with plastic and metallic materials) were also tested to assess how material properties and curved surfaces affect the quality of the 2D point cloud. All numerical data was obtained using the LD19 desktop software by clicking on the point in each cluster nearest to zero degrees (straight ahead), so only the distance and intensity values are of interest. It is important to note that the observed 2D point clouds were not perfectly static, leading to fluctuations in all three values. However, the overall shapes shown in the figures below were consistent.